In the last weeks I have created a survey to gather informations, which can potentially give me some ideas about my software and how I can improve it in order to fulfil expectations of potential clients. To analyse all of data gathered I used charts that were generated automatically in the Google Forms and SWOT Analysis of data in charts.
 In the first part of my survey I am asking respondents about themselves do predict if there are any chances that they are on some higher positions in companies that they are working for. The variation of both higher age and higher education - age 30+ and bachelors level of education and above makes possibilities that the respondent is currently on some higher position.
I decided to use this variation instead of asking respondent directly, because I am aware of that maybe not everyone want to share such information with survey even if they are anonymous.
As we are able to see on the chart there is an impressive number of people who have education on destined level, however, the age is not on level that I am looking for. That means there is no high business and software selling possibilities.
 In second part of my survey I gathered information about profession and revenue of respondents. This part can be used as extension to first part of my survey and give me even better knowledge about status of my respondents, but also I can use it as a standalone part to analyse.
Analysing this part of survey I can see opportunities for future development and release of software as most of respondents are still students.
However, there are also people from industries that I am interested in, which can give me better knowledge how can I develop my software in future in order to customise it for my final clients. At current moment it is the best idea to make software for universities and for IT related clients.
Furthermore, analysing revenues I am able to see that 30.4% of respondents is having income on level that is high enough to be on some high position in company, which can actually be meaningful when it comes to software and tools choose - one of this software can be fruit / image recognition.
 In third part I am trying to analyse if there are any possibilities to advertise in order to attract attention of potential customers or/and companies that will see any profits in using such software.
In the first chart I have gathered knowledge, whether respondents used image recognition before. As there is almost half of respondents that never used image recognition AI based software before there is good background to convince them to actually use it in theirs company as a helping software that can make everyone life easier in terms of work.
In the second chart I am able to see that again almost half of respondents do not know how to use / utilize such software. Situation like this makes a good background for making an advertisement of my software to attract attention of potential companies and/or customers that can be likely to utilize my software to make life of people easier, cut the cost and offer current employees jobs, which are more human related - office jobs, etc.

Part four of my survey occurs only when respondent in the part three ticked a box that he have no idea how to use and if he never used such software before. The reason why I decided to put that additional section to my survey is to inform respondents how to use such software and the second purpose is to advertise my software partially to make a background for the real advertisement.

However, when I was making this part of survey I have also make a small mistake. To clarify, I make the survey endless if respondent will tick that they are not familiar yet. It was a small manipulation of votes that's why in this section a 100% of responses is saying that they are familiar now.
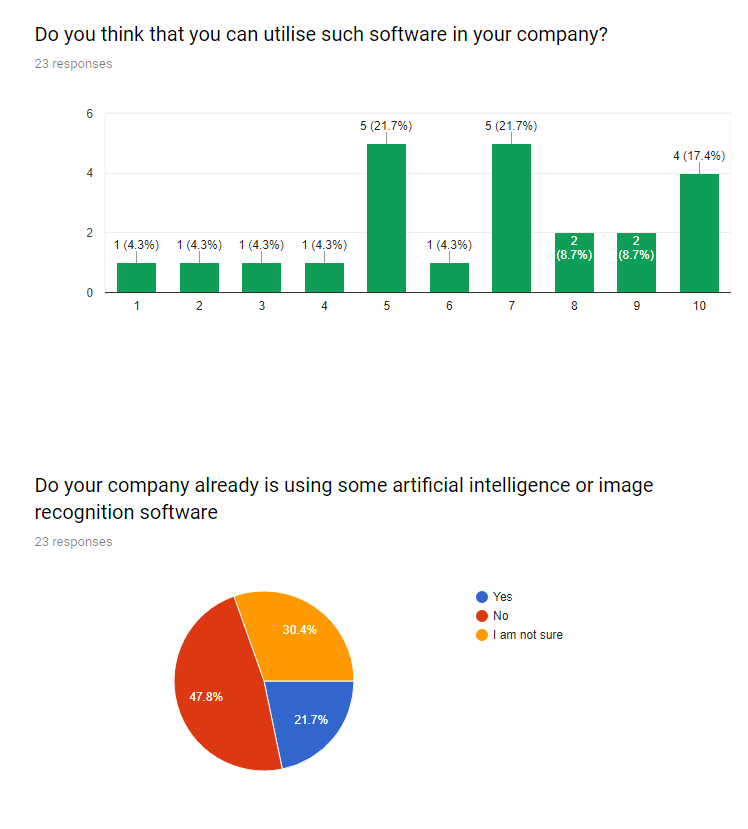
In part five, I analysed two charts. In the first chart I am able to see how many persons is interested in implementing intelligent software in their companies. As we can see on the chart only 17.2% of respondents respondent from 1-4, and 26% of respondents respondent on average level, which is 5 and 6. I am very impressed as most of the people is more than likely interested in implementing such solutions in theirs companies in per-cents it is 56.5% of respondents interested on level 7-10.
Furthermore, analysing second chart we can see that 47.8% of companies that respondents work for are currently not using artificial intelligence software. It makes a gap for new software based on AI like the Fruit Recognition software, which I recently developed. The percentage of companies that are not using currently such software can be even bigger as 30.4% of respondents is not sure, whether their companies already implemented such solutions.
The fifth part of my survey is the last part for people who responded that their company is not currently using an AI or image recognition software.
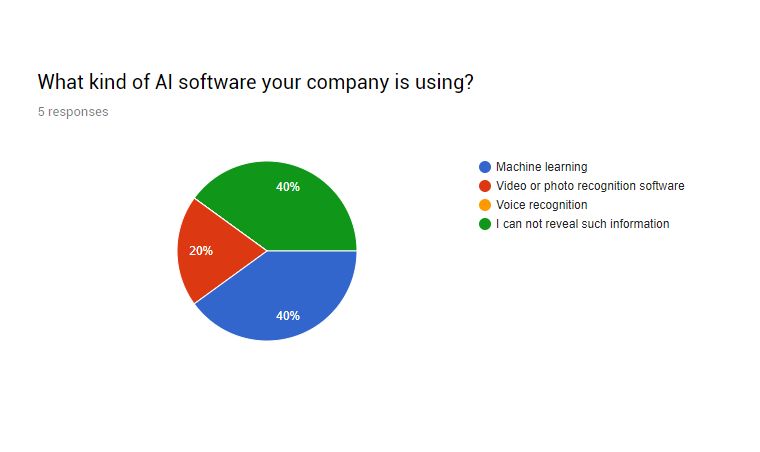 In part six, I tried to gather information about competitors software to analyse if there are any threats, however, only 20% of competitors companies is currently using video or photo based recognition software. That statistics only assures me that it is worth spending time developing software like my as it can be beneficial in both financial and self-development aspects in the future.

I decided to use this variation instead of asking respondent directly, because I am aware of that maybe not everyone want to share such information with survey even if they are anonymous.
As we are able to see on the chart there is an impressive number of people who have education on destined level, however, the age is not on level that I am looking for. That means there is no high business and software selling possibilities.
Analysing this part of survey I can see opportunities for future development and release of software as most of respondents are still students.
However, there are also people from industries that I am interested in, which can give me better knowledge how can I develop my software in future in order to customise it for my final clients. At current moment it is the best idea to make software for universities and for IT related clients.
Furthermore, analysing revenues I am able to see that 30.4% of respondents is having income on level that is high enough to be on some high position in company, which can actually be meaningful when it comes to software and tools choose - one of this software can be fruit / image recognition.
In the first chart I have gathered knowledge, whether respondents used image recognition before. As there is almost half of respondents that never used image recognition AI based software before there is good background to convince them to actually use it in theirs company as a helping software that can make everyone life easier in terms of work.
In the second chart I am able to see that again almost half of respondents do not know how to use / utilize such software. Situation like this makes a good background for making an advertisement of my software to attract attention of potential companies and/or customers that can be likely to utilize my software to make life of people easier, cut the cost and offer current employees jobs, which are more human related - office jobs, etc.
Part four of my survey occurs only when respondent in the part three ticked a box that he have no idea how to use and if he never used such software before. The reason why I decided to put that additional section to my survey is to inform respondents how to use such software and the second purpose is to advertise my software partially to make a background for the real advertisement.
However, when I was making this part of survey I have also make a small mistake. To clarify, I make the survey endless if respondent will tick that they are not familiar yet. It was a small manipulation of votes that's why in this section a 100% of responses is saying that they are familiar now.
In part five, I analysed two charts. In the first chart I am able to see how many persons is interested in implementing intelligent software in their companies. As we can see on the chart only 17.2% of respondents respondent from 1-4, and 26% of respondents respondent on average level, which is 5 and 6. I am very impressed as most of the people is more than likely interested in implementing such solutions in theirs companies in per-cents it is 56.5% of respondents interested on level 7-10.
Furthermore, analysing second chart we can see that 47.8% of companies that respondents work for are currently not using artificial intelligence software. It makes a gap for new software based on AI like the Fruit Recognition software, which I recently developed. The percentage of companies that are not using currently such software can be even bigger as 30.4% of respondents is not sure, whether their companies already implemented such solutions.
The fifth part of my survey is the last part for people who responded that their company is not currently using an AI or image recognition software.
SWOT Analysis
I prepared an SWOT analysis, which helped me in understanding and in final analysis of the charts. It is important to analyse properly and deeply software, which we want to develop to avoid any unnecessary costs created by costs of software development and management.
I will not explain this analysis as it is explained throughout this blog post. However, I will explain why there are some parts in both for example threats and opportunities - looking for respondents that have revenue below £50 000 it can be opportunity as such people working for industries that I am aiming at can be more than likely to improve the position their are at now (promotion at work) by offering advanced software, which can reduce working costs of the company.
However, it can be also analysed as threat, because, not everyone is able to convince people on higher positions at jobs. It applies especially for workers without good presenting skills and good speaking skills - it is obligatory to have such skills to correctly present benefits of utilising advanced and not easy to understand for everyone software.
Reflection:
There is few things that can be done better in my survey, however, there are factors that influenced it and I do not have control to overcome all of them.
Firstly, there is small amount of responses gathered from users. The reason I do not have that many responses are the following:
- link to survey shared only on Google+ Community and the Reddit,
- a narrow group of recipient,
- actual program was not uploaded and shared with wider community on the internet.
With that low amount of responses gathered it is hard to analyse and further develop software that can be useful in industry, however, I tried my best to analyse all responses correctly and carefully.
Secondly, survey like this should be shared with industries that can potentially have profit from software like this instead of gathering information from random people in the internet.
In my final thoughts and reflection I am happy with responses I have gathered and from possibility that I had to analyse strategies basing on data provided from real human beings.
To conclude, I have analysed thoroughly the responses gathered from survey users, explained each section of my analysing, and I tried to justify my assumptions. Additionally, I have prepared SWOT analysis on which I was basing when I was explaining each section and each chart and finally I have reflected about the survey.
Feel free to leave a comment below this post.
This is an excellent, in-depth, analytical response to your survey results. You have added a high level of commentary and included SWOT analysis which shows a very high level of engagement with the results and contextual commentary to your project development. Excellent work Patryk!
ReplyDeletePlease do not leave posts in draft as it looks like you are not using your blog consistently over the course. I hope to see all the missing content soon as your final submission is rapidly approaching!! I would hope to see the case study, final reflection and some process of your development included as well.
ReplyDeleteThank you Carrie for your feedback to my work. I put a lot of effort into my recent blog posts. Unfortunately I think that I am not able to finish all my blog posts before 9 AM
ReplyDelete